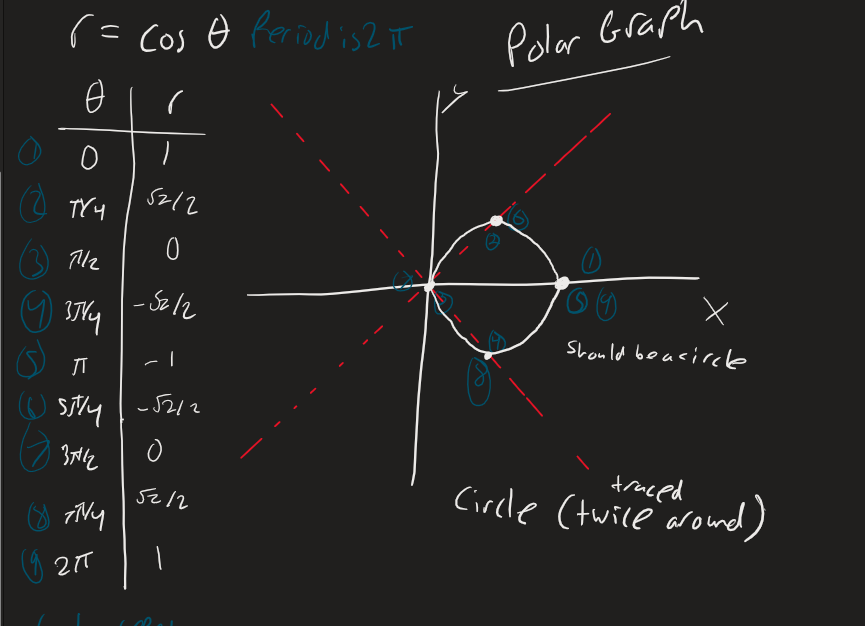
#Calc-2#Math#Polar Graphing in the Polar Coordinate System The easiest way to graph polar equations is to choose values of theta and figure out the r values and then slowly plot them. It is very helpful if you label the points so that you can actually see where each point is, sometimes points in polar end up on top of each other.
You must graph to to get the full picture of a polar graph, but sometimes you can abuse the fact that the trig functions will just repeat
Simple Polar Graph
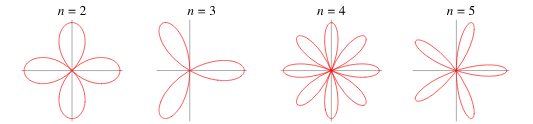
Rose
A rose has the form of or where n is an integer. They both have the same shape, but one is slightly rotated from the other.
If n is odd, the rose will have n petals (e.g. the simple polar graph above) If n is even, the rose will have 2n petals
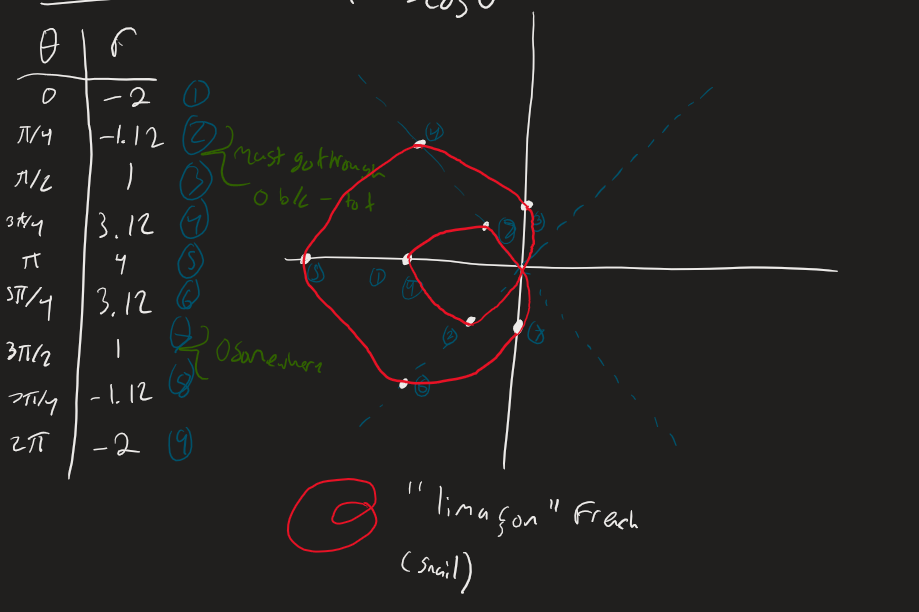
Limaçon (means snail in French)
Example:
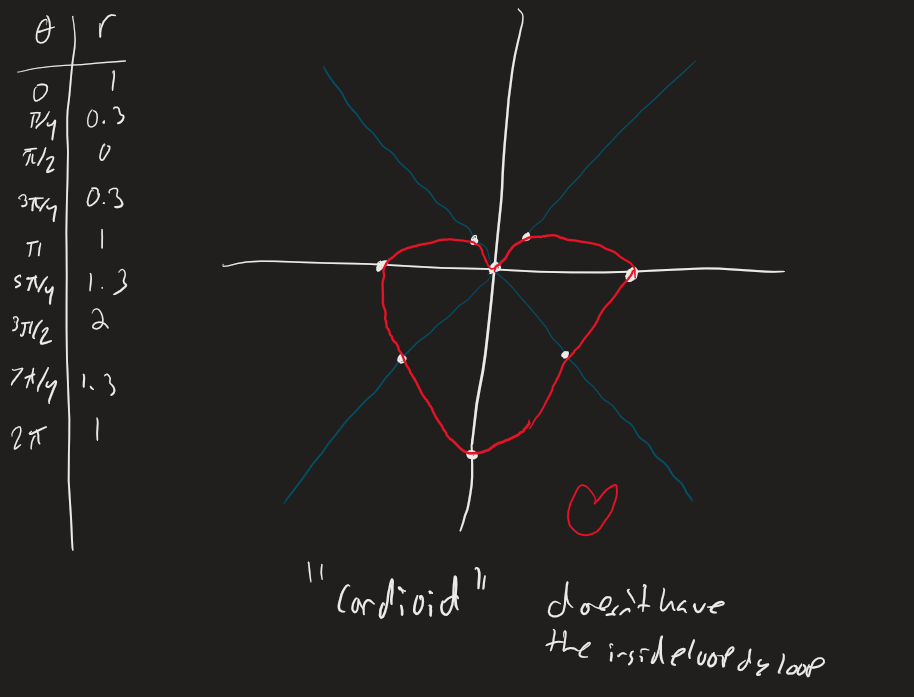
Cardioids
Example: